
A Denver-area client came to us spending $4,000 a month on Google Ads. Their site had solid traffic. But their website conversion rate optimization was non-existent. Their conversion rate was stuck at 1.2%, meaning for every 100 visitors, only one person filled out the contact form.
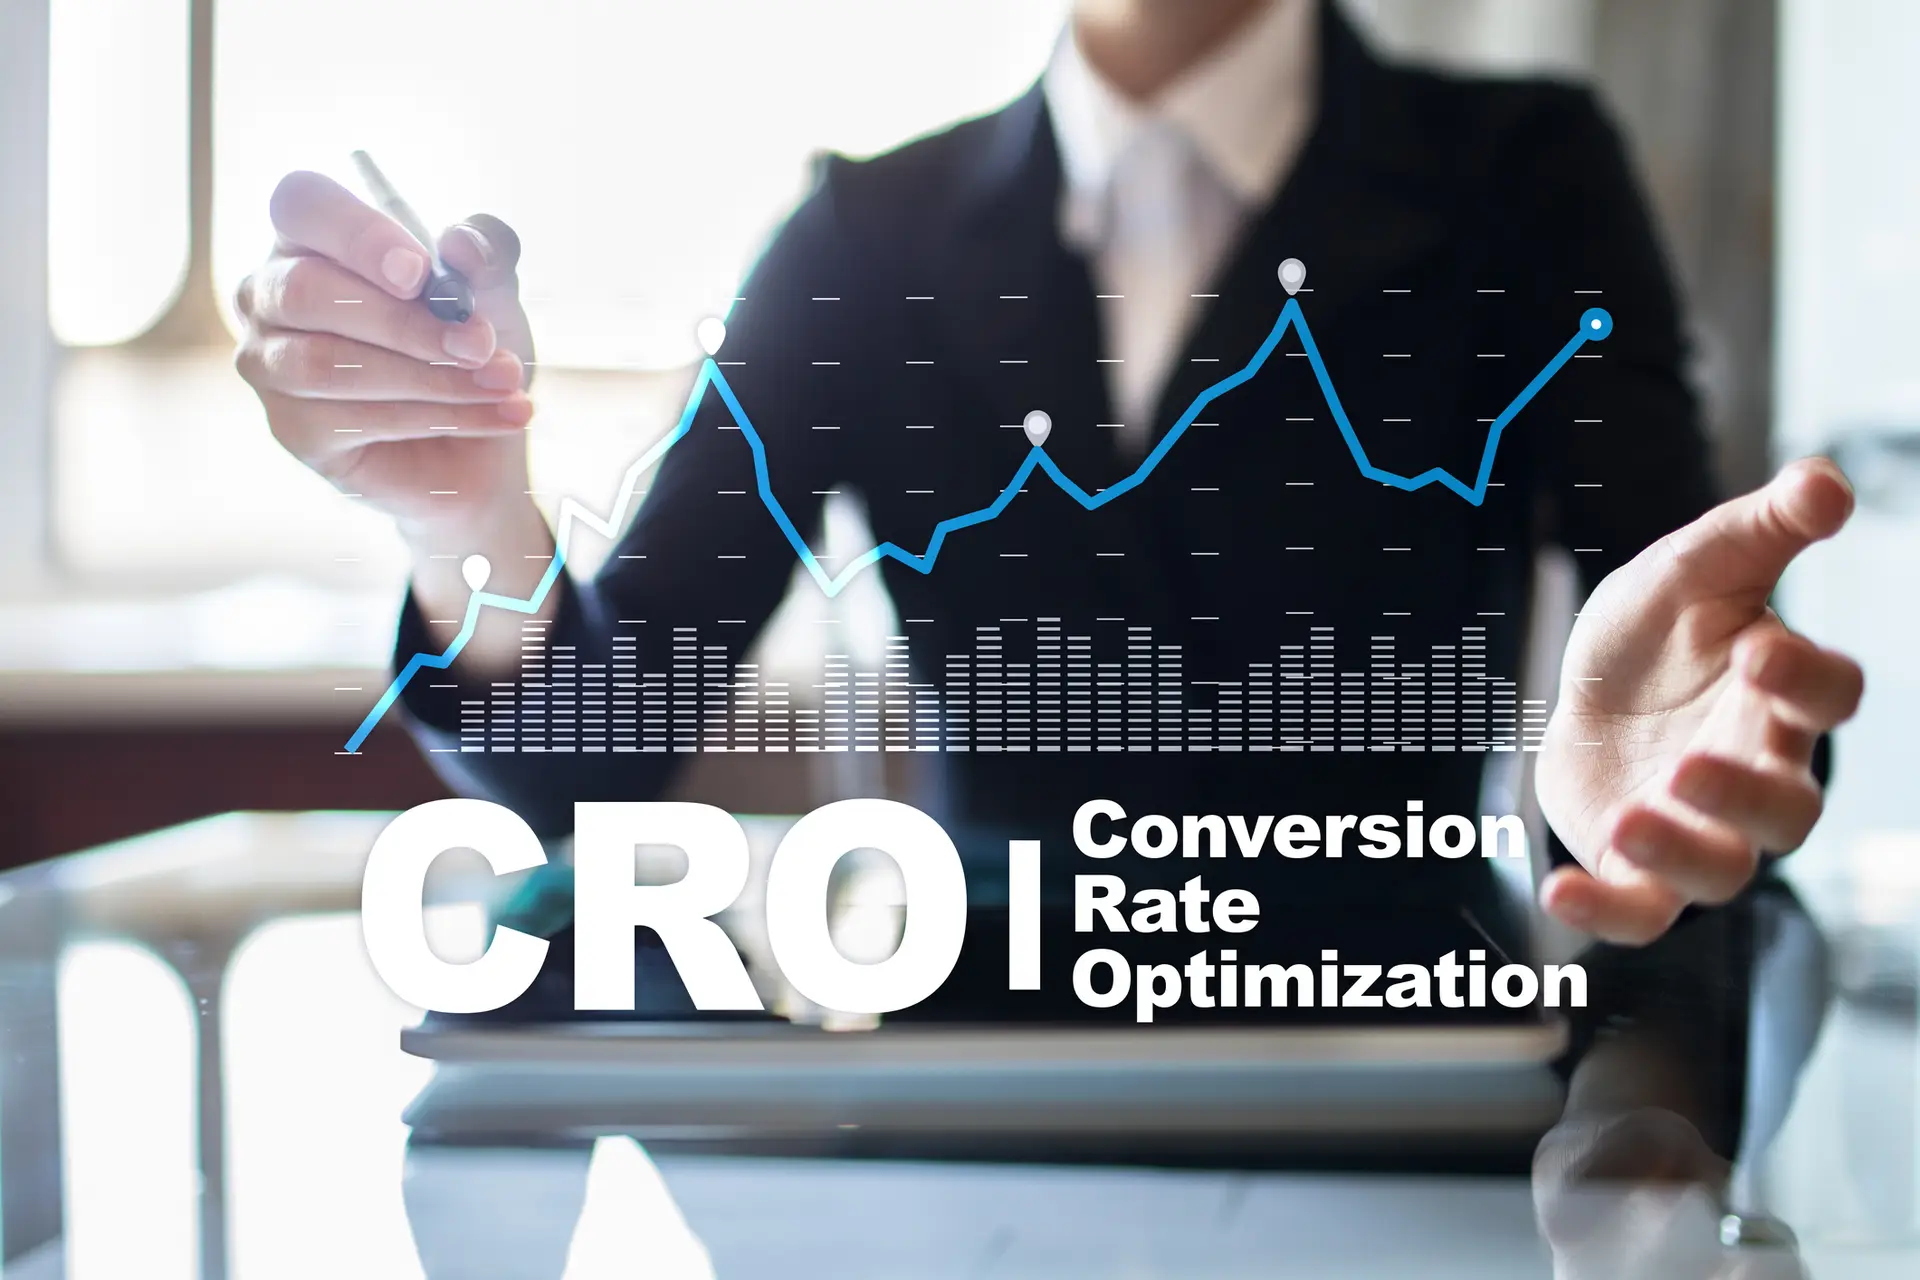
Website conversion rate optimization (CRO) is the process of increasing the percentage of your website visitors who take a desired action — filling out a form, making a purchase, or calling your business. You calculate it by dividing conversions by total visitors and multiplying by 100. A site with 1,000 monthly visitors and 30 form submissions has a 3% conversion rate.
The math for that client didn't work. They were paying for clicks that went nowhere. Every month, hundreds of potential customers landed on their site, looked around, and left without taking action. More traffic wasn't the answer — they needed to fix what happened after the click, which is exactly where quick SEO wins and CRO diverge.
We didn't increase their ad budget. We fixed the pages those visitors were landing on. Within 90 days, their conversion rate hit 3.8%. Same traffic. Same budget. Three times the leads. That's what this guide covers.
Key Takeaways
- A 1% improvement in conversion rate can mean thousands in additional revenue without spending more on ads or traffic.
- Most conversion problems come from three areas: slow pages, confusing CTAs, and broken mobile experiences.
- Data beats opinions. Use heatmaps and A/B testing before changing anything.
- Quick wins exist. Simple form and CTA changes can improve conversions in days, not months.
- Denver businesses have a local advantage. CRO combined with local SEO can significantly outperform national competitors on high-intent queries.
01: StrategyWhy Website Conversion Rate Optimization Beats More Traffic
Most businesses focus on getting more traffic. They invest in digital marketing in Denver, run more ads, publish more content. Traffic matters. But traffic without conversions is just an expense.
Here's a simple example. Say you get 10,000 visitors a month and your conversion rate is 2%. That's 200 leads. If you double your traffic to 20,000, you get 400 leads, but you also doubled your marketing spend.
Now keep the same 10,000 visitors and improve your conversion rate to 4%. You get 400 leads without spending an extra dollar on traffic. That's the math. It's why CRO consistently delivers higher ROI than traffic campaigns for established sites.
📊 Data Point: The average website conversion rate across all industries is 2.35%. The top 25% of sites convert at 5.31% or higher. That gap represents real revenue left on the table every month. (Source: WordStream Conversion Rate Benchmarks — foundational benchmark data, consistent with Unbounce and Ruler Analytics reports)
We see this pattern constantly with Colorado businesses, particularly in Cherry Creek and the Denver Tech Center (DTC), where B2B service companies are spending aggressively on paid search but converting at sub-2% rates. The traffic strategy is fine. The page strategy isn't.
02: FoundationStep 1: Know Your Conversion Rate Numbers Before Changing Anything
You can't improve what you don't measure. Before making any changes to your website conversion rate optimization strategy, get a clear picture of where you stand.
Start with Google Analytics 4. Look at your overall conversion rate, but don't stop there. Break it down by traffic source, device type, and landing page. Your paid traffic likely converts differently than organic, and desktop visitors behave differently than mobile users.
Track these numbers to start:
- Overall site conversion rate
- Conversion rate by traffic source (organic, paid, social, referral)
- Conversion rate by device (desktop vs. mobile vs. tablet)
- Top landing page performance
- Form abandonment rate
Once you have this baseline, you'll know exactly where to focus. If your mobile conversion rate is half your desktop rate, that's your first priority. If paid traffic converts well but organic doesn't, your blog content needs better CTAs. Numbers first, fixes second.
Conversion Rate Benchmarks by Industry
| Industry | Average Rate | Top Performers |
|---|---|---|
| E-commerce | 1.5 – 3% | 5%+ |
| B2B / SaaS | 2 – 5% | 7 – 10% |
| Professional Services | 3 – 5% | 8 – 12% |
| Healthcare | 2 – 4% | 6 – 8% |
| Real Estate | 1 – 3% | 4 – 6% |
| Legal | 2 – 4% | 7 – 10% |
03: DiagnosisStep 2: Find and Fix the Friction Points Hurting Your Conversion Rate
Every website has friction. Those are the moments where a visitor gets confused, frustrated, or distracted enough to leave. Your job is to find those moments and remove them.
Heatmap tools like Hotjar and Microsoft Clarity show you exactly where visitors click, how far they scroll, and where they stop. Both have free plans. This data is worth more than any opinion about what "looks good."
The most common friction points we find on Colorado business websites:
- Slow page load times (anything over 3 seconds costs conversions)
- Confusing navigation that makes visitors work too hard
- Forms that ask for too much information upfront
- Missing or weak value propositions above the fold
- Pages that don't match the ad or link that brought visitors there
Google measures site performance using Core Web Vitals: Largest Contentful Paint (LCP) tracks how fast your main content loads, Cumulative Layout Shift (CLS) measures how much elements jump as the page renders, and Interaction to Next Paint (INP) measures how quickly your site responds to clicks or taps. If any of these are in the red on Google PageSpeed Insights, your conversion rate is paying the price. Check our CRO audit checklist for the full diagnostic process we use with clients.
⚠️ Reality Check: Google research shows that a 1-second delay in mobile page load time can reduce conversions by up to 20%. If your site takes more than 3 seconds to load, fix your speed before you change anything else. Run your site through PageSpeed Insights first.
The process is straightforward: watch real visitor sessions, identify where people drop off, then test changes at those specific points. Don't redesign your whole site based on a hunch. Fix the specific problems the data shows you.
04: ExecutionStep 3: Build CTAs That Improve Your Conversion Rate
Your calls-to-action are where website conversion rate optimization succeeds or fails. A weak CTA buried at the bottom of a page will always underperform a clear, visible one placed where visitors are ready to act.
Placement. Put your primary CTA above the fold. Add secondary CTAs at natural decision points throughout the page. Your landing pages should have at least two clear conversion opportunities. See our guide to hiring a digital marketing agency if you're evaluating outside help for this.
Language. Be specific about the value. "Start Your Free Trial" beats "Sign Up." "Get a Free Website Audit" beats "Contact Us." Tell people what they get, not what they have to do.
Design. Use a contrasting color that stands out from your page. Make the button large enough to tap easily on mobile. Leave white space around it so it doesn't get buried.
🔄 Before & After: CTA Copy
Before: A client's contact page had a single button that said "Submit." Their form completion rate was 2.1%.
After: We changed the button text to "Get My Free Marketing Audit" and added a support line: "Takes 30 seconds. No commitment." Form completions jumped to 3.9%. Same page. Same traffic. Different words.
Specificity converts. Tell people exactly what they'll get and how easy it is.
📈 Results We've Seen With Denver Clients
B2B Services Client: Reduced form fields from 8 to 3, simplified the layout, rewrote the CTA. Conversion rate went from 1.8% to 4.2% in 6 weeks.
E-commerce Client: Added customer reviews next to the "Add to Cart" button and simplified the mobile checkout flow. Conversion rate improved from 2.1% to 3.6%.
Healthcare Client (Colorado): Fixed page speed issues (load time dropped from 5.2s to 1.8s) and added a click-to-call button for mobile. Form submissions increased 68%.
06: MobileStep 5: Close the Mobile Conversion Rate Gap
Mobile traffic accounts for over 50% of all web visits, but mobile conversion rates are typically half of desktop rates. That gap is costing you money every single day.
Mobile visitors have less patience and less screen space. Your site needs to work for them specifically, not just "look okay" on a phone.
Focus on these mobile-specific fixes:
- Buttons at least 44x44 pixels, large enough to tap with a thumb
- Single-column layout that scrolls naturally
- Form fields reduced to the absolute minimum
- Images compressed to keep load times under 3 seconds
- Click-to-call buttons on any page that lists a phone number
Test your site on actual phones. Not the responsive preview in your browser. Open it on an iPhone and an Android device. Try to complete your own conversion process. You'll catch issues that never show up on desktop. For more on site structure and technical performance, see our quick SEO wins guide.
In practice, mobile issues are the first thing we fix on almost every Colorado client site we audit. The problems are usually the same: tap targets too small, forms asking for too much, and load times that haven't been touched since the site launched. None of it is complicated to fix — it just never gets prioritized until someone's tracking it.
07: AdvancedStep 6: Advanced CRO Tactics That Move the Needle
Once you've handled the basics, these more advanced website conversion strategies can push your numbers higher.
A/B testing. Test one variable at a time: headline, CTA color, form length, page layout. Run each test long enough to get statistically significant results (typically 2-4 weeks depending on traffic). Tools like VWO or Optimizely make this straightforward for most teams.
Personalization. Show different content based on visitor behavior. A returning visitor doesn't need your introductory pitch again. Someone who came from a specific ad should land on a page that matches that ad's message.
Exit-intent offers. When a visitor moves their cursor toward the browser's close button, trigger a specific offer. A well-timed 10% discount or free resource can recover 5-15% of otherwise lost visitors.
Live chat. Sometimes visitors have a quick question before they're ready to convert. A chat widget gives them an instant answer instead of bouncing to find it elsewhere. This is especially effective on paid advertising landing pages where visitors arrive with high intent.
AI-powered CRO tools. In 2026, tools like Mutiny and Intellimize can automatically generate and test landing page variations at scale. AI chatbots from Drift and Intercom qualify leads in real-time and route them to sales. If you're running meaningful traffic volume, AI-powered testing finds winning combinations faster than manual A/B tests. Pair this with solid digital marketing in Denver and you have a compounding system, not just a one-time fix.
08: MistakesCommon Website Conversion Rate Mistakes We See Every Week
After working with dozens of businesses on conversion rate optimization, here are the mistakes we see most often.
Redesigning based on opinions. "I think the homepage should look different" isn't a conversion strategy. Use data. Watch session recordings. Test changes against your current design before committing.
Ignoring mobile. If you haven't tested your site on actual mobile devices in the last 30 days, do it today. Mobile problems are the most common and most expensive conversion killers we find, especially on older WordPress sites that were never built mobile-first.
Too many choices. Offering visitors 10 different CTAs on one page is worse than offering one. Decision fatigue is real. Each page should have one primary action you want visitors to take.
Slow follow-up. CRO doesn't end when someone fills out a form. If your response time is measured in days instead of minutes, you're losing leads you already earned. Studies show that responding within 5 minutes makes you 100x more likely to connect with a lead. (Source: Harvard Business Review)
⚠️ Reality Check: CRO is not a one-time project. The best-converting sites test constantly and make small improvements over time. Set a monthly calendar reminder to review your analytics and look for new opportunities.
For a structured approach to running this yourself, our CRO audit checklist walks through the 15 points we check on every client website.
09: FAQFrequently Asked Website Conversion Rate Optimization Questions
The average across all industries is about 2.35%. Top performers hit 5% or higher. The number that matters most is yours. Measure it, then beat it. If you're at 2%, aim for 3%. Small improvements compound fast. Use the benchmarks table above to see where your industry falls.
Most businesses see measurable results within 4-8 weeks. Quick wins can show up faster. Changing a CTA button from "Submit" to "Get My Free Quote" takes five minutes and can move the needle immediately. Bigger structural changes like page redesigns or full A/B testing programs typically need 2-3 months to produce statistically valid results. Start somewhere. Something is always better than nothing.
Start with free tools. Google Analytics 4 for baseline data. Hotjar or Microsoft Clarity for heatmaps and session recordings (both have free tiers). For A/B testing, VWO and Optimizely offer trials. The most important tool is your own website on your own phone. Open it. Try to convert. See what frustrates you.
Conversion rate, almost every time. Doubling your conversion rate has the same revenue impact as doubling your traffic, but it costs a fraction of the price. Fix the leaks before you pour more water. Once your site converts well, then scale your traffic. You'll get much more out of every dollar you spend on ads or SEO.
Guessing instead of testing. We've seen companies spend $50,000 on a website redesign that actually decreased conversions because nobody tested the new design against the old one first. Always start with data. Watch where visitors drop off. Then test specific changes before committing to a full overhaul. Your gut feeling is not a conversion strategy.
It has an outsized impact. Mobile traffic is over 50% of all web visits, but mobile conversion rates are typically half of desktop. That's a massive revenue gap hiding in plain sight. The fixes are usually straightforward: faster load times, bigger buttons, shorter forms, click-to-call functionality. If you do one thing after reading this post, test your website on your phone right now.
When your traffic is steady but leads aren't growing, or when you've already fixed speed and mobile issues but conversions are still stuck. A CRO specialist runs the data analysis, designs the tests, and interprets the results so you're not guessing. For Colorado businesses, working with a local agency means they understand the market context that a national firm might miss.
That Denver-area client we mentioned at the top is still spending $4,000 a month on Google Ads. But now they generate three times the leads, and their cost per acquisition dropped by 60%. The difference wasn't more traffic. It was a better website doing more with the traffic they already had.
Pick one section from this guide. Make one change this week. Measure it. Then move to the next. That's how website conversion rate optimization actually works — not a single redesign, but a system of small, tested improvements that compound every month.
If you want a structured place to start, the CRO audit checklist walks through the 15 points we check on every client website. Run it yourself in under an hour and you'll know exactly where your site is losing leads.
Ready to Improve Your Conversion Rate?
Creative Options Marketing helps Denver businesses turn more visitors into customers. We'll review your site and show you where you're losing leads.
Schedule a Free Consultation →No obligation. No sales pitch. Just a straight answer about your site.


05: TrustStep 4: Add Social Proof to Lift Conversion Rates
People trust other people more than they trust your marketing copy. Social proof reduces the perceived risk of taking action on your site.
The most effective forms for converting visitors into leads:
Placement matters as much as the proof itself. A testimonial on your About page doesn't help conversions. A testimonial right next to your "Request a Quote" button does. Put your social proof where visitors are making decisions, not where it's convenient for you.
📊 Data Point: 93% of consumers say online reviews influence their purchasing decisions. Pages with testimonials and reviews convert up to 270% higher than those without. (Source: BrightLocal Local Consumer Review Survey 2026)
For Denver and Front Range businesses competing against national players, local social proof is especially effective. Colorado-specific testimonials, named clients in LoDo or RiNo, or recognition from local business associations signal to visitors that you're accountable to the same community they're in.